2. JSON to CSV Conversion
Background:
In our prior walkthrough, data extraction from Xero was performed resulting in JSON format files. JSON files employ a hierarchical structure consisting of nested dictionaries, organizing data into key-value pairs, with potential expansion into additional key-value pairs. This inherent structure presents challenges for accountants accustomed to tabular formats such as Excel.
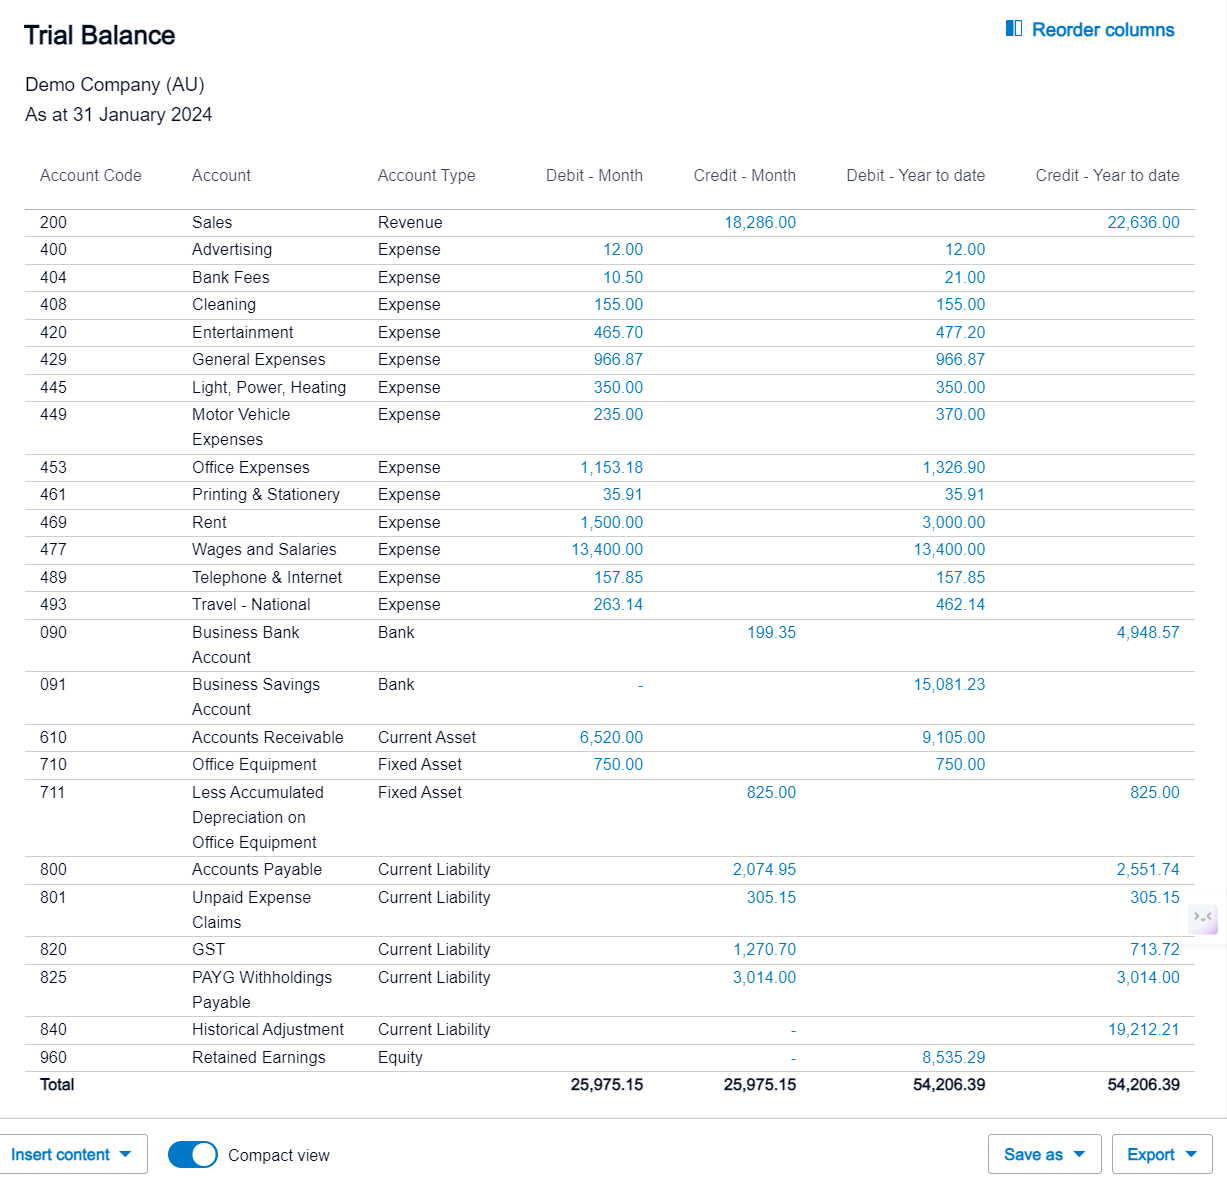
Upon examination of the top segments of our Xero trial balance, it becomes evident that data is organized within nested dictionaries. To facilitate usability, it is imperative to normalize or flatten the JSON data structure.
1
2
3
4
5
6
7
8
9
10
11
12
13
14
15
16
17
18
19
20
21
22
23
24
25
26
27
28
29
30
31
32
33
34
35
36
37
38
39
40
41
42
43
44
45
46
47
48
49
50
51
52
53
54
55
56
57
58
59
60
61
62
63
64
65
66
67
68
69
70
71
72
73
74
75
76
77
78
79
80
81
82
83
84
85
86
87
88
89
90
91
92
93
94
95
96
97
98
99
100
101
102
103
104
105
106
107
108
109
110
111
112
113
114
115
116
117
118
119
120
121
122
123
124
125
126
127
128
129
130
131
132
133
134
135
136
137
138
139
140
141
142
143
144
145
146
147
148
149
150
151
152
153
154
155
156
157
158
159
160
161
162
163
164
165
166
167
168
169
170
171
172
173
174
175
176
177
178
179
180
181
182
183
184
185
186
187
188
189
{

  "Id": "1c8cb66e-c7db-4bf4-9620-27926461ea5a",

  "Status": "OK",

  "ProviderName": "myApp",

  "DateTimeUTC": "\/Date(1712829803118)\/",

  "Reports": [

    {

      "ReportID": "TrialBalance",

      "ReportName": "Trial Balance",

      "ReportType": "TrialBalance",

      "ReportTitles": [

        "Trial Balance",

        "Demo Company (AU)",

        "As at 31 January 2024"

      ],

      "ReportDate": "11 April 2024",

      "UpdatedDateUTC": "\/Date(1712829803118)\/",

      "Fields": [],

      "Rows": [

        {

          "RowType": "Header",

          "Cells": [

            {

              "Value": "Account"

            },

            {

              "Value": "Debit"

            },

            {

              "Value": "Credit"

            },

            {

              "Value": "YTD Debit"

            },

            {

              "Value": "YTD Credit"

            }

          ]

        },

        {

          "RowType": "Section",

          "Title": "Revenue",

          "Rows": [

            {

              "RowType": "Row",

              "Cells": [

                {

                  "Value": "Sales (200)",

                  "Attributes": [

                    {

                      "Value": "e2bacdc6-2006-43c2-a5da-3c0e5f43b452",

                      "Id": "account"

                    }

                  ]

                },

                {

                  "Value": "",

                  "Attributes": [

                    {

                      "Value": "e2bacdc6-2006-43c2-a5da-3c0e5f43b452",

                      "Id": "account"

                    }

                  ]

                },

                {

                  "Value": "18286.00",

                  "Attributes": [

                    {

                      "Value": "e2bacdc6-2006-43c2-a5da-3c0e5f43b452",

                      "Id": "account"

                    }

                  ]

                },

                {

                  "Value": "",

                  "Attributes": [

                    {

                      "Value": "e2bacdc6-2006-43c2-a5da-3c0e5f43b452",

                      "Id": "account"

                    }

                  ]

                },

                {

                  "Value": "22636.00",

                  "Attributes": [

                    {

                      "Value": "e2bacdc6-2006-43c2-a5da-3c0e5f43b452",

                      "Id": "account"

                    }

                  ]

                }

              ]

            }

          ]

        }
Goal
Our objective is to transform the JSON data into a tabular format suitable for subsequent analysis. The desired outcome is to present the data in a structured table similar to the following:
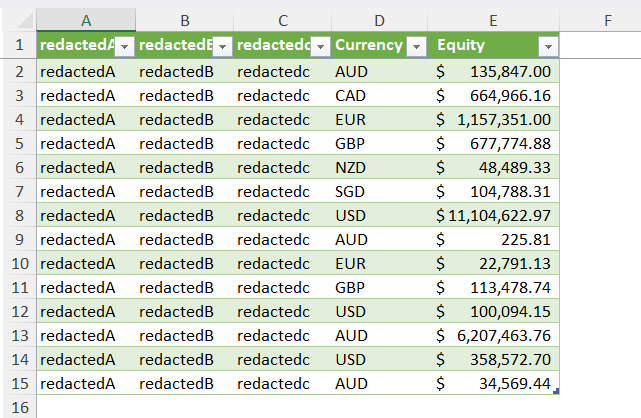 Simplified data example
Steps
Requirements: Python
JSON files require examination on a case-by-case basis, though the overall method will be the same.
For this particular example, a methodical approach is necessary to flatten the data into a tabular format. Let’s go through this step-by-step:
We will navigate to 1st level "Reports", 2nd level "Rows", 3rd level "Rows", 4th level "Cells", 5th level "Value". Should you follow this path, you can see that the first value would be "Sales (200)", which is the first general ledger account. You can then see that for each item under "Cells" at the 4th level, the data under concern is always stored in "Value".
Therefore, the solution would be to loop through each item at the 4th level
"Cells"and extract all"Value"values.However, note that at the 3rd level
"Rows", the first item where"RowType": "Header"lies does not contain a"Rows"key at the 4th level - it does contain our headers though we will ignore them in this demonstration. As a result, we will need to introduce anIFlogic check to exclude this header section.We can then store all values within a Python list via an
append()method, and write all rows to a blank CSV file.Please replace the file paths below with the applicable ones on your system.
1
2
3
4
5
6
7
8
9
10
11
12
13
14
15
16
17
18
19
20
21
22
23
24
25
26
27
28
29
import json
import csv

# Load the JSON data
with open('C:/Users/roypa/Downloads/xero_output.json') as f:
    data = json.load(f)

# Initialize an empty list to store all rows
all_rows = []

# Iterate over each report
for report in data['Reports']:
    # Iterate over each section in the report
    for section in report['Rows']:
        # Check if the section has rows
        if 'Rows' in section:
            # Iterate over each row in the section
            for row in section['Rows']:
                # Append the row to the list
                all_rows.append(row)

# Convert the rows to CSV format
if all_rows:
    with open('C:/Users/roypa/Downloads/xero_output.csv', 'w', newline='') as csvfile:
        writer = csv.writer(csvfile)
        for row in all_rows:
            if 'Cells' in row:
                writer.writerow([cell.get('Value', '') for cell in row['Cells']])
If done correctly, you should be able to generate a CSV file displaying the following:
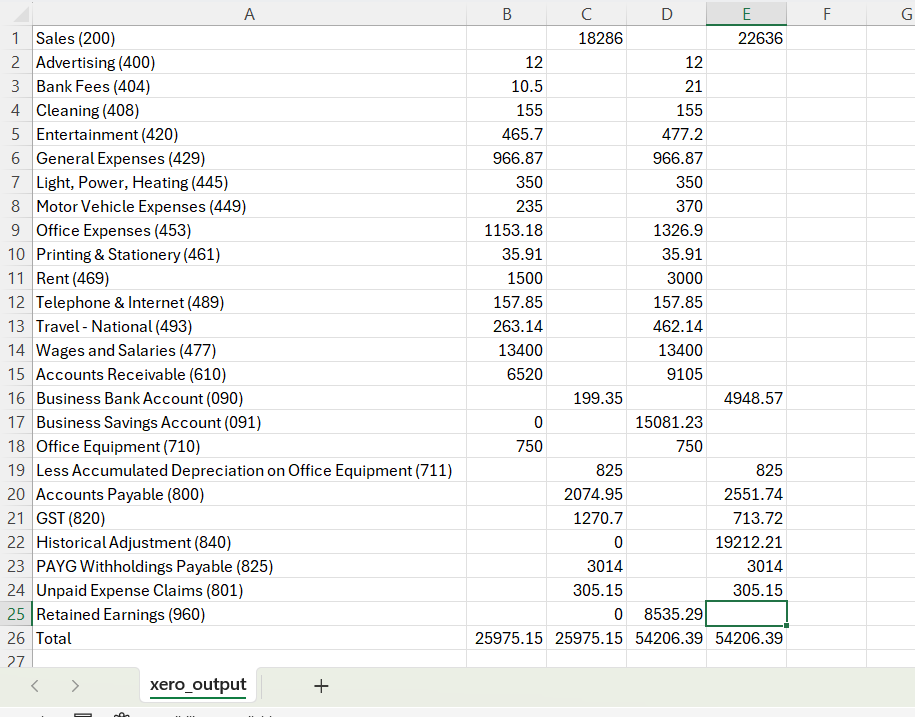
If we compare the CSV output directly with Xero’s Trial Balance function, you will see that they align seamlessly.
Outcome
The transformed tabular data offers versatile integration options, such as direct incorporation into Excel workpapers or backup storage in a corporate network drive. From this point, various possibilities emerge, including automated reporting snapshots, self-refreshing Tableau dashboards, and centralized data repositories.
In our next example, we will apply the acquired knowledge to a different scenario, focusing on extracting transaction listings.