7. Automated Month-end Forecast Rollover
Background:
Month-end rollover can sometimes be a very manual process when proper integrations between data sources and workpapers are lacking. Operational or financial data for the new month would be downloaded, transformed, and uploaded manually for various reports.
This walkthrough discusses a potential solution for simultaneous rollover for financial reporting in various environments, such as Tableau, scheduled Excel reports and Power Query connections etc. Regardless of how many reports or dashboards exist, all of them can be easily managed via the introduction of a universally accessible system variable database table. Report versions can be controlled at the click of a button - e.g. convenient rollover from Jul-24 forecast to Aug-24 forecast for multiple departments, divisions, projects etc.
Goal
Our current objective is to setup a database table containing one single row of variables that can be inner-joined to various other fact tables to facilitate rollover. This setup can then be incorporated into dashboards or other scheduled/ad-hoc reporting.
We will also design a simple frontend GUI so end-users can easily toggle system variables back and forth depending on reporting needs. This grants designated users centralized control over data distribution.
Steps
Requirements: SQL database (MySQL used here), Python
You can use any database setup - e.g. PostgreSQL via Xata mentioned in prior walkthroughs. However, a local MySQL server would be used for this demonstration instead. For further information regarding MySQL Server, MySQL Workbench and MySQL ODBC setup, please refer to official website here, as this is considered out of scope.
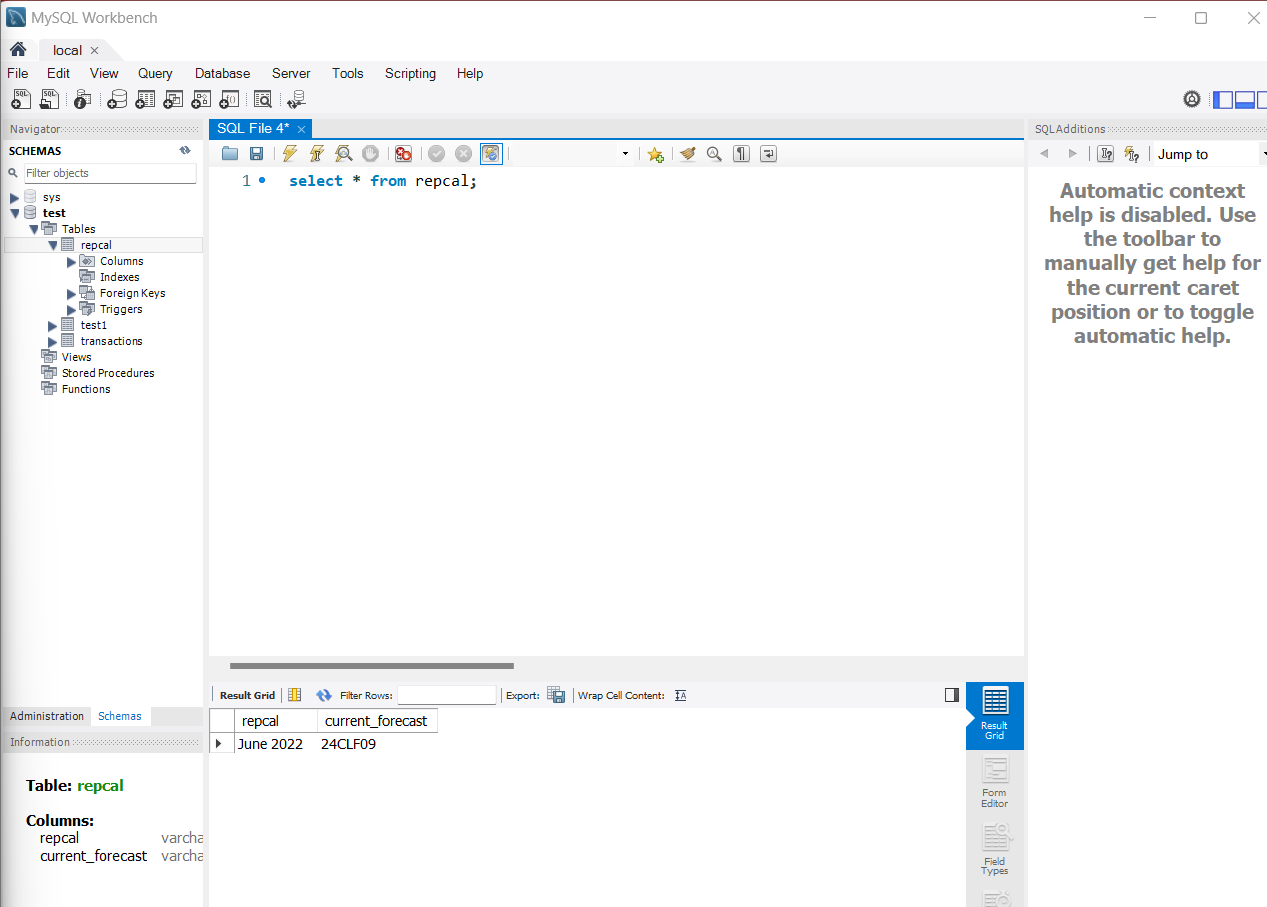
We will now create a table within our pre-existing database called repcal, which stands for “reporting calendar”. This system variable table will be designed to have only one row, though said row can contain as many columns as needed to act as the various input parameters for our reporting. In this example, only a description column and a current forecast ledger column will be created.
Use the following MySQL script:
1
2
3
4
5
6
7
8
9
create table repcal(
    repcal varchar(50)
    , current_forecast varchar(20)
);

insert into repcal values
    ('June 2022', '24CLF09');

select * from repcal;
You should now see a table show up with a single row containing the variables previously mentioned.
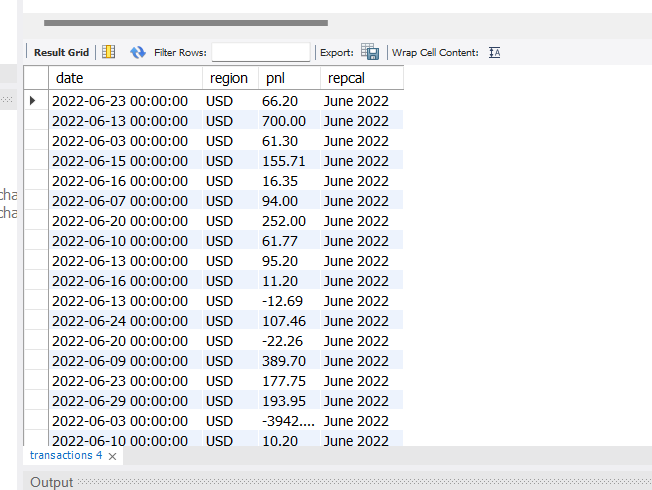
We will now assume that you have transactional data, either operational or financial, that also contains a matching repcal column, with various values based on period. The sample data used in this walkthrough contains dummy PnL data by region from June 2022 to August 2022.
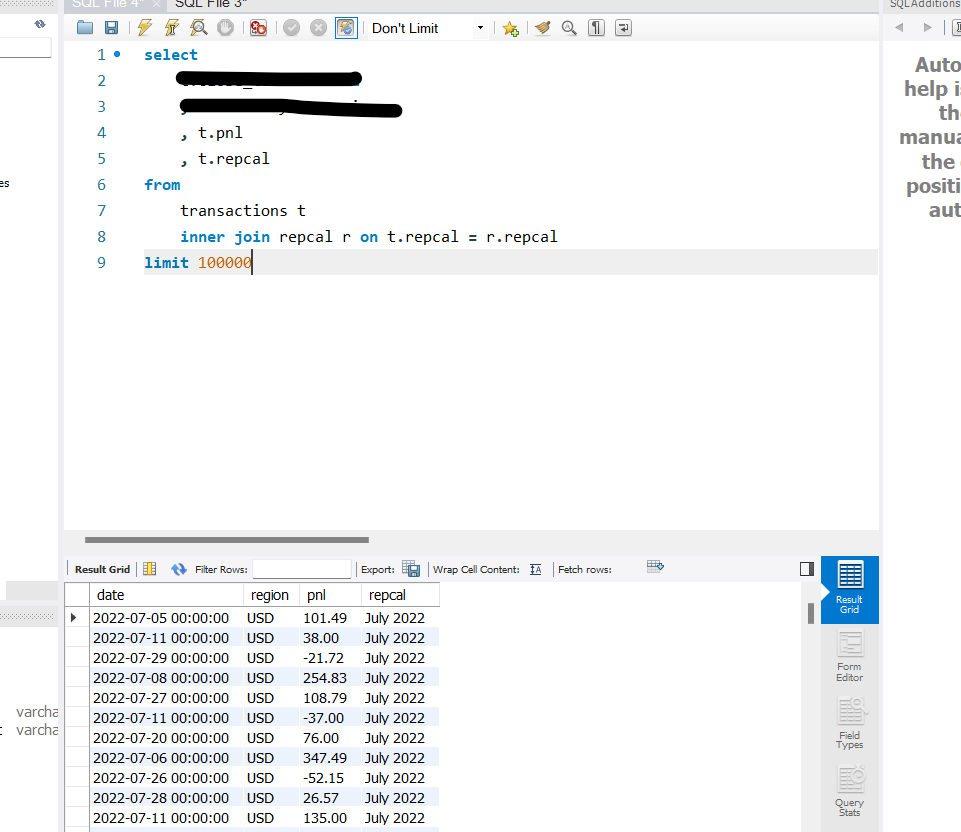
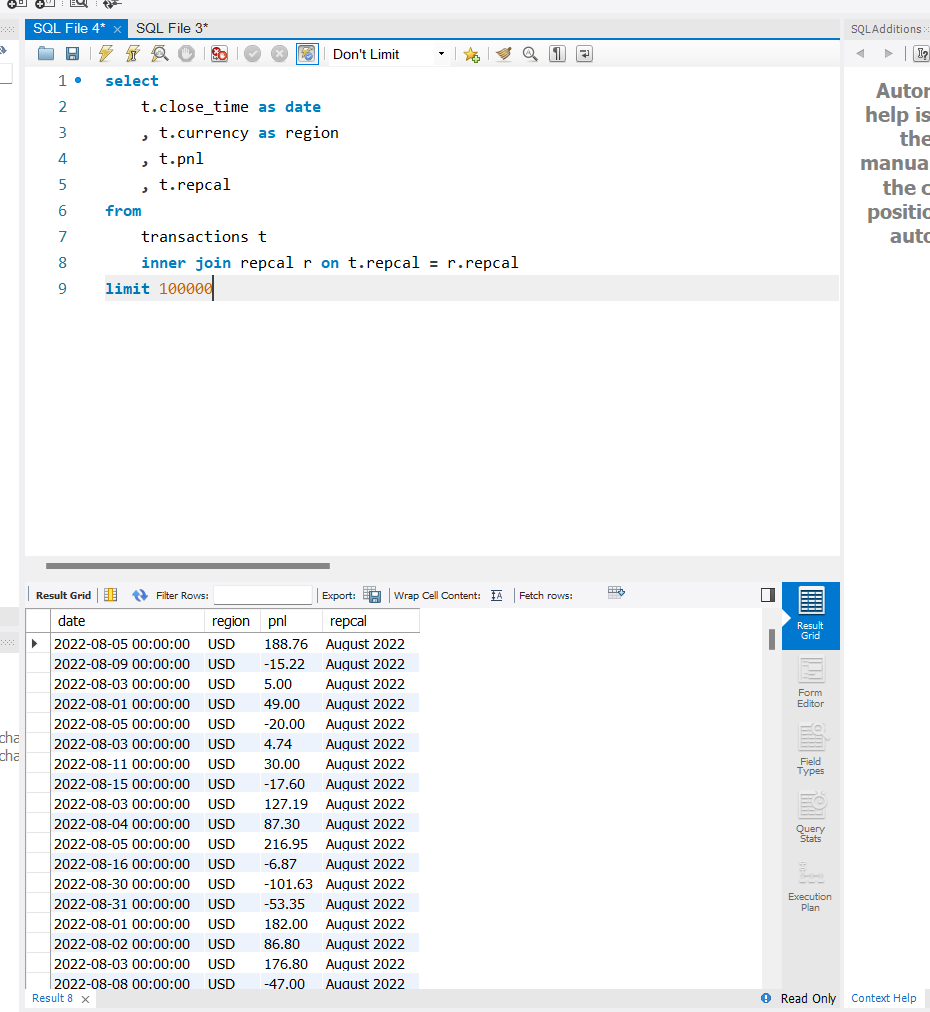
We will now use a simple inner join statement to link our repcal table to our fact table by the repcal variable:
1
2
3
4
5
6
7
8
9
select
    t.date
    , t.region
    , t.pnl
    , t.repcal
from
    transactions t
    inner join repcal r on t.repcal = r.repcal
limit 100000
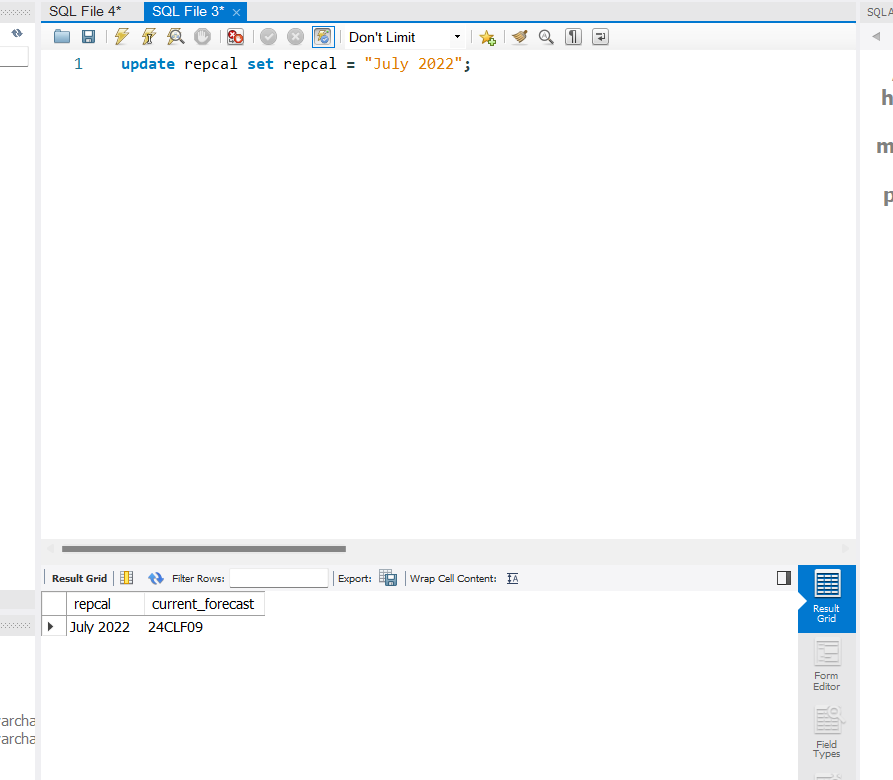
The query result will now always display the rows related to the current active repcal variable. Should we choose to change the repcal variable “July 2022”, then the query above would give us July 2022 results only:
Given we have the basic database tables setup, we now need to setup the frontend GUI so non-technical end-users can update the repcal system variable table at will.
We will now use the following Python script that helps us generate a popup window with dropdown menus. The dropdown menu values can then be pushed into repcal via preset SQL statements:
1
2
3
4
5
6
7
8
9
10
11
12
13
14
15
16
17
18
19
20
21
22
23
24
25
26
27
28
29
30
31
32
33
34
35
36
37
38
39
40
41
42
43
44
45
46
47
48
49
50
51
52
53
54
55
56
57
58
59
60
61
62
63
64
65
66
67
68
69
70
71
72
73
74
75
76
77
78
79
80
81
82
83
import tkinter as tk
from tkinter import messagebox
from tkinter import ttk
import mysql.connector

# Function to fetch data from MySQL database
def fetch_data():
    try:
        connection = mysql.connector.connect(
            host="localhost",
            user="root",
            password="5438",
            database="test"
        )
        cursor = connection.cursor()

        # Assuming the database has only one row and one column
        cursor.execute("SELECT repcal FROM repcal;")
        result = cursor.fetchone()

        if result is not None:
            # Update the label with the fetched value
            label_value.config(text=result[0])
        else:
            messagebox.showinfo("Info", "No data found in the database.")

        cursor.close()
        connection.close()
    except mysql.connector.Error as error:
        messagebox.showerror("Error", f"Failed to fetch data: {error}")

# Function to update data in MySQL database
def update_data():
    new_value = combo_value.get()
    try:
        connection = mysql.connector.connect(
            host="127.0.0.1",
            user="root",
            password="5438",
            database="test"
        )
        cursor = connection.cursor()

        # Assuming the database has only one row and one column
        cursor.execute(f"UPDATE repcal SET repcal = '{new_value}'")
        connection.commit()
        messagebox.showinfo("Success", "Data updated successfully!")

        cursor.close()
        connection.close()
    except mysql.connector.Error as error:
        messagebox.showerror("Error", f"Failed to update data: {error}")

# Create GUI
root = tk.Tk()
root.title("MySQL Database GUI")

# Display label for current value
label = tk.Label(root, text="Current Reporting Calendar:")
label.grid(row=0, column=0, padx=10, pady=10)
label_value = tk.Label(root, text="")
label_value.grid(row=0, column=1, padx=10, pady=10)

# Button to fetch data
fetch_button = tk.Button(root, text="Fetch Value", command=fetch_data)
fetch_button.grid(row=1, column=0, columnspan=2, padx=10, pady=5)

# Dropdown menu for updating value
entry_label = tk.Label(root, text="Select New Value:")
entry_label.grid(row=2, column=0, padx=10, pady=5)

# Values for the dropdown menu
values = ["January 2022", "February 2022", "March 2022", "April 2022", "May 2022", "June 2022", "July 2022", "August 2022", "September 2022", "October 2022", "November 2022", "December 2022"]
combo_value = ttk.Combobox(root, values=values, state="readonly")
combo_value.grid(row=2, column=1, padx=10, pady=5)
combo_value.current(0)  # Set the default value

# Button to update data
update_button = tk.Button(root, text="Update Value", command=update_data)
update_button.grid(row=3, column=0, columnspan=2, padx=10, pady=5)

root.mainloop()
If you run the Python script, you should see the following window:
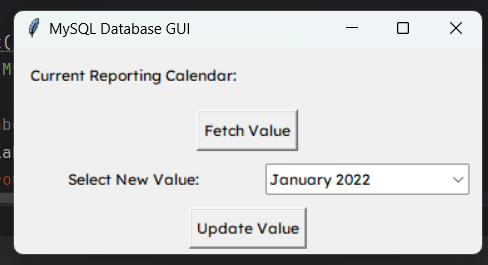
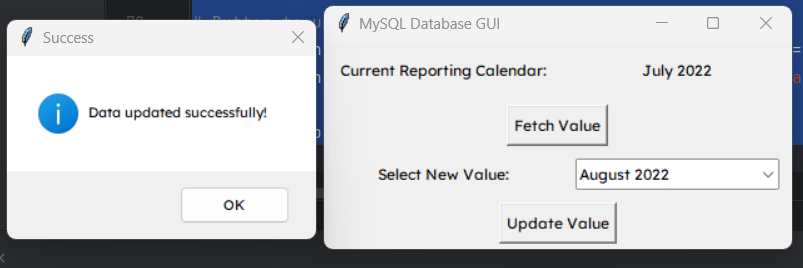
Click on Fetch Value to obtain the current repcal value. Select the month you want in the dropdown menu and then click Update Value to update the repcal table.
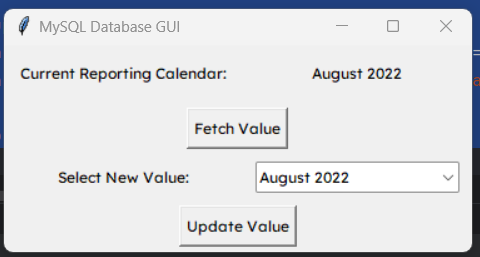
If you run the previous SQL query for transaction data, it will now show “August 2022” values instead:
You can also use this to update various Tableau dashboards. We now have a simple dashboard using the data from our previous SQL query to generate charts and tabular data. Using our new frontend tool, we can rollover data from July 2022 to August 2022 at the click of a button:
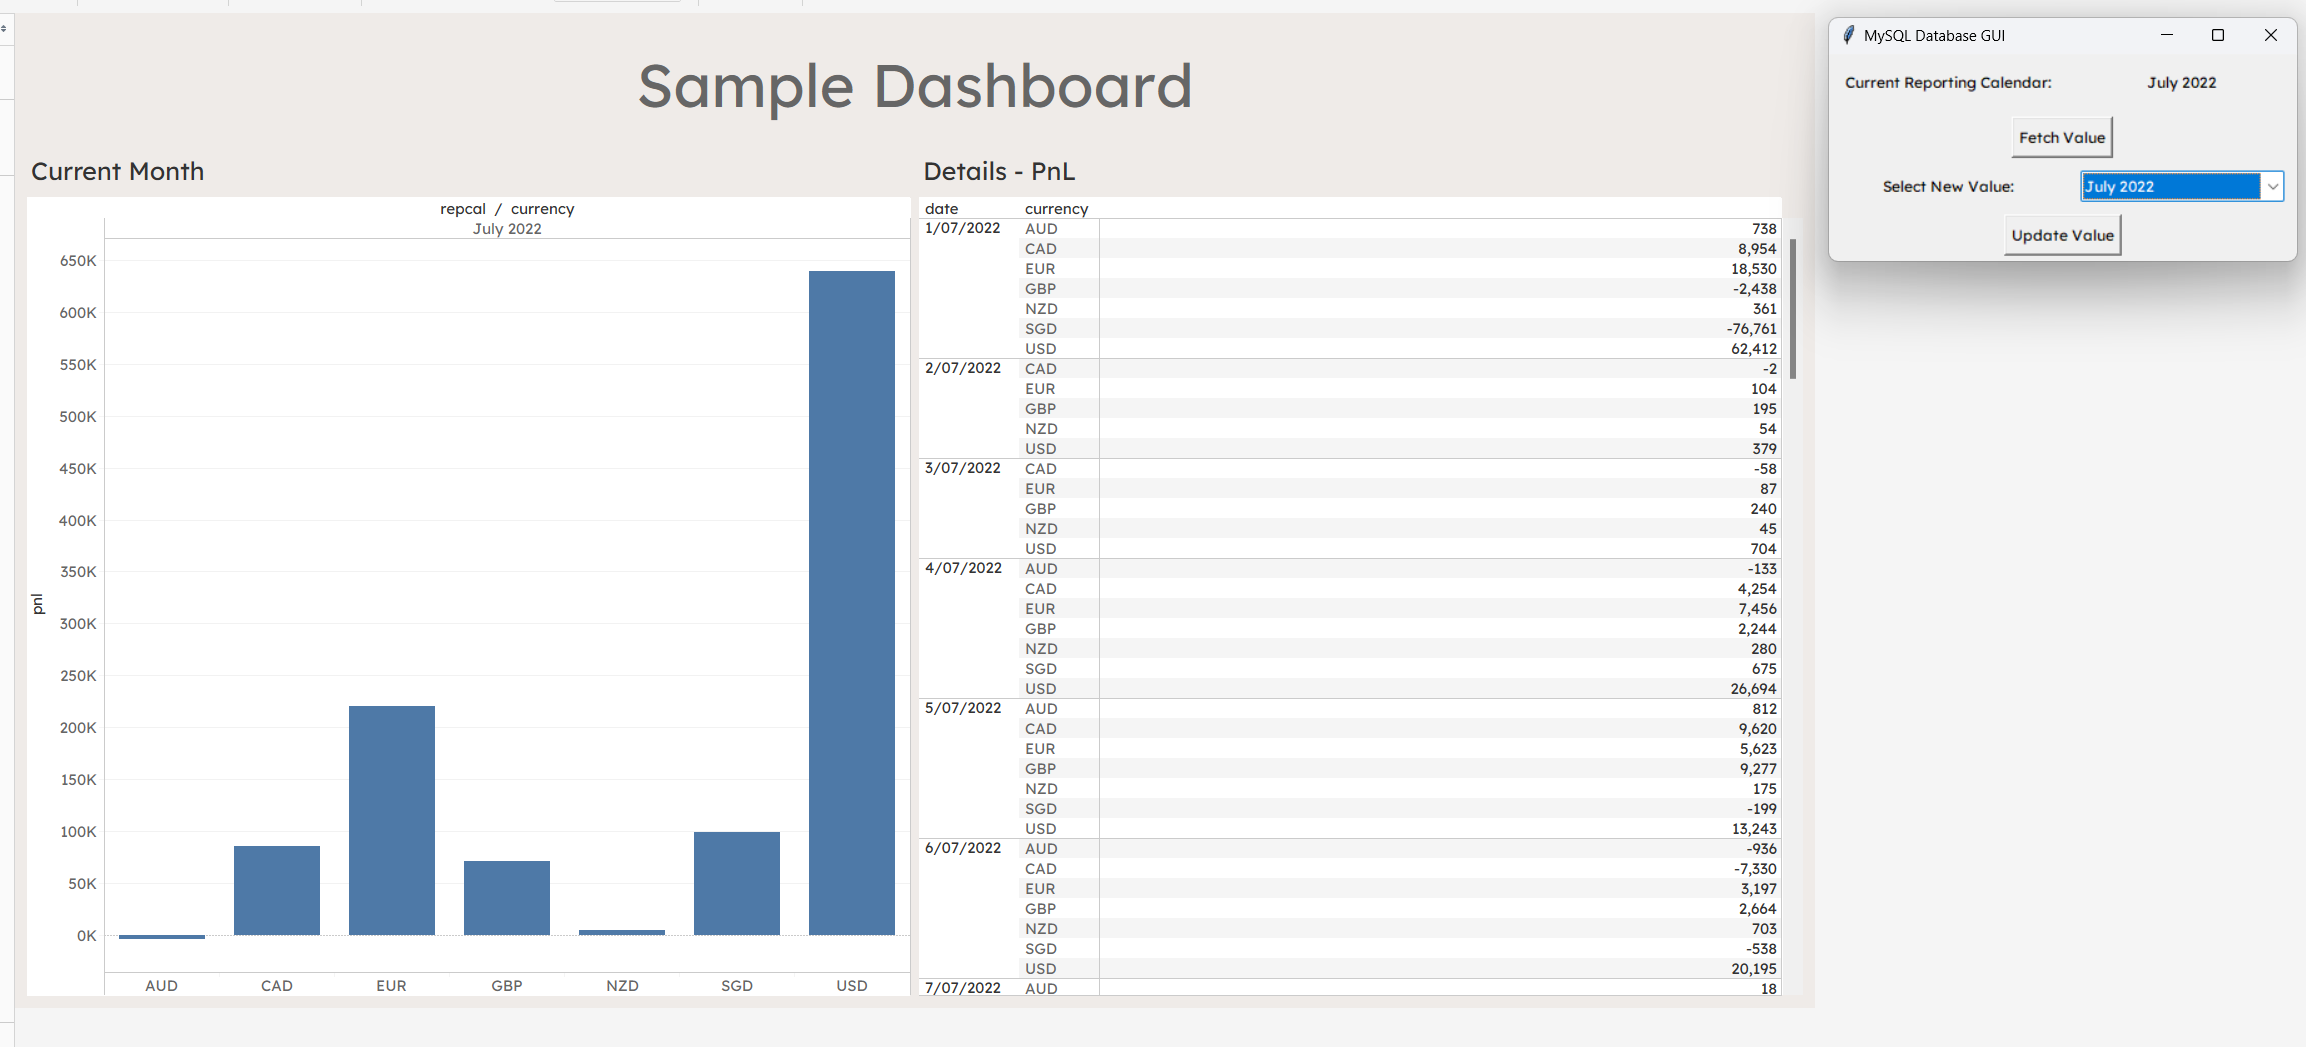 July 2022
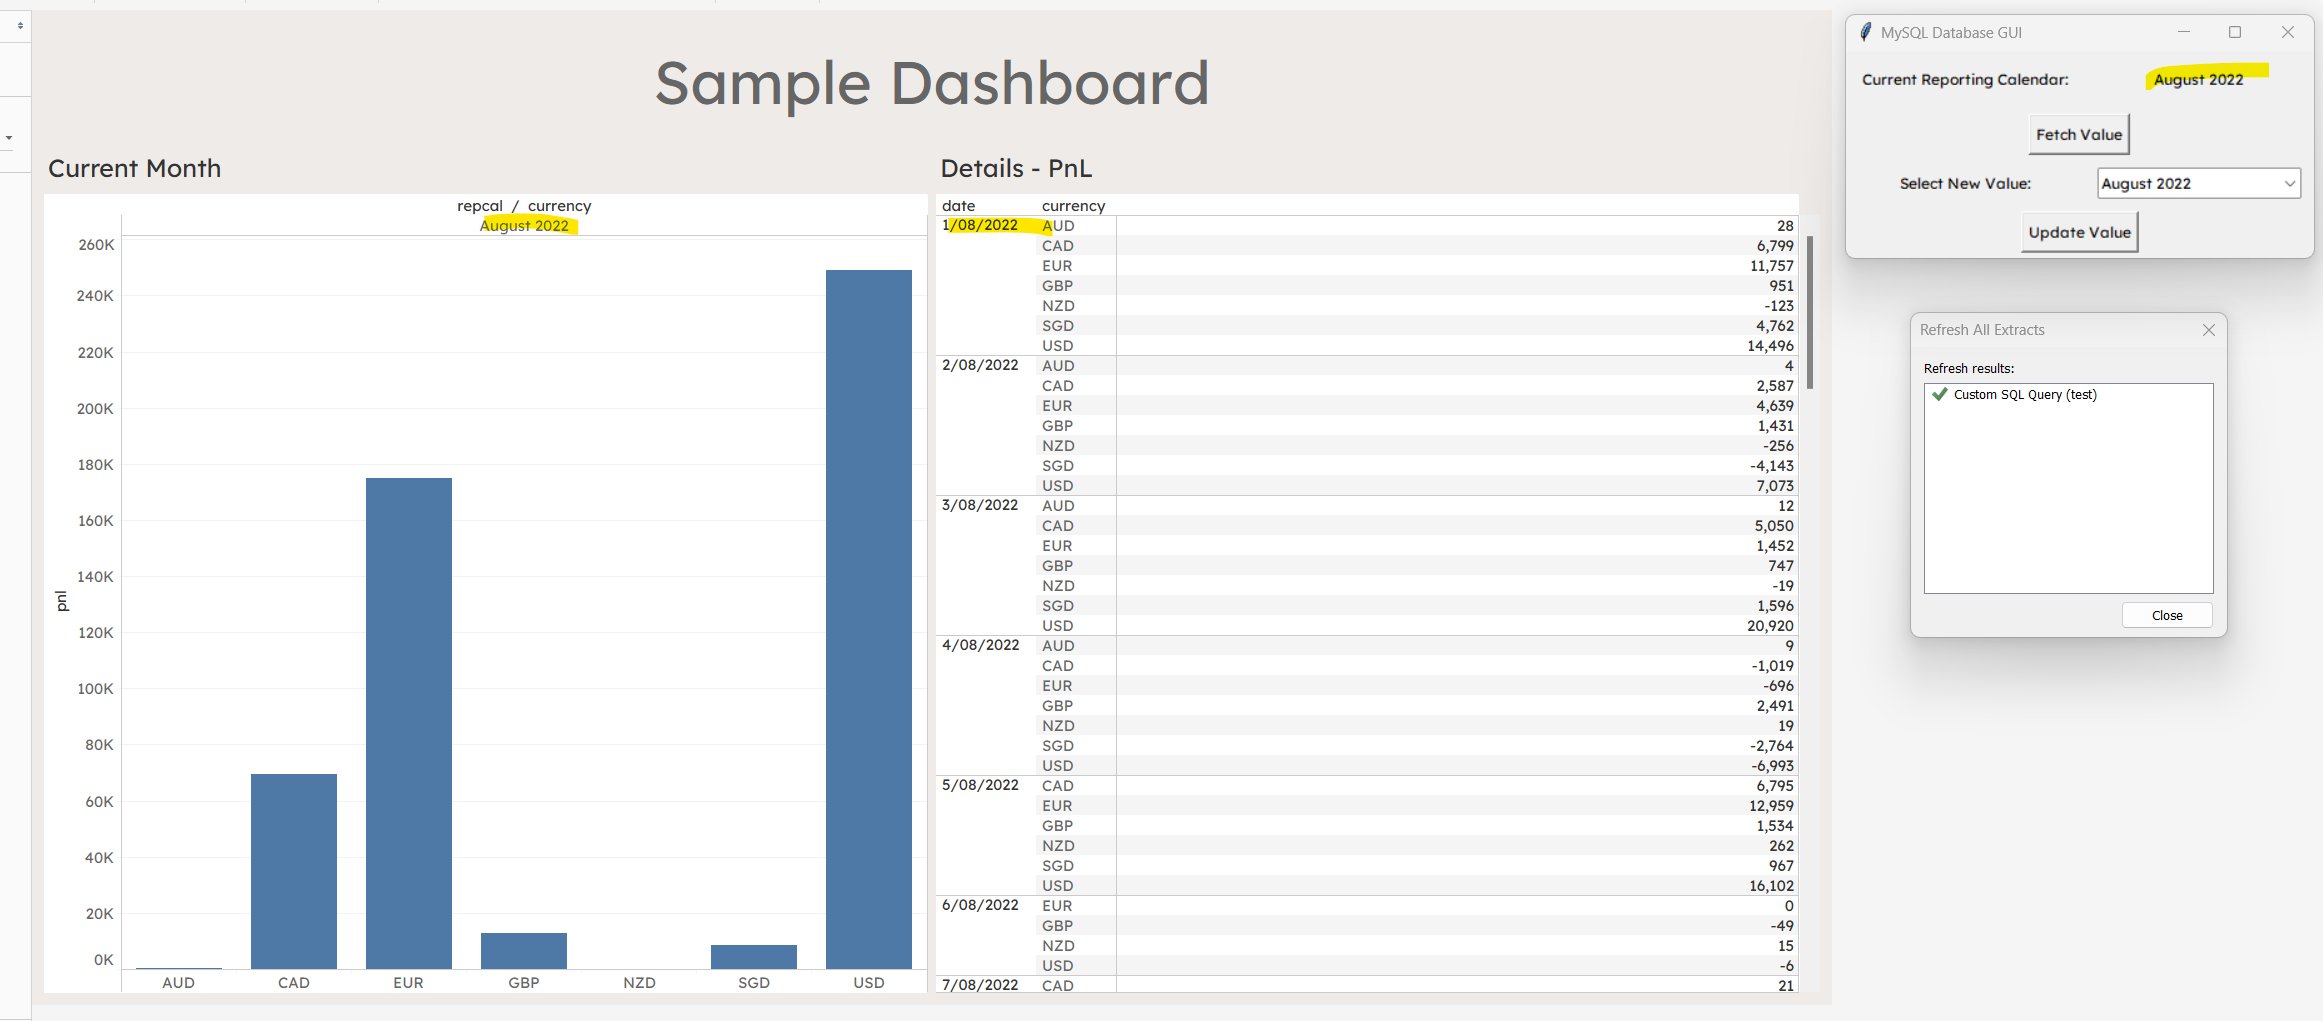 August 2022
Outcome:
Leveraging system variables significantly aids in the month-end versioning of financial reports and dashboards, offering the potential to substantially reduce preparation time. Expanding upon the single row mentioned above allows for the inclusion of a diverse range of variables to be integrated into various reports. Centralizing the management of these variables within a single database table also facilitates long-term maintenance and troubleshooting processes.